Saramsh Gautam on Apr 29, 2025
Reading Time: 9 Min
Possessing data alone is not enough; the key lies in leveraging data to capture insights, but if the data is complex, the outcome becomes more difficult to predict.
Imagine possessing a magical wand that collects, cleanses, analyzes, and visualizes complex data into desired insights in a single spin. It is what Power BI does, a powerful software designed to harness the secrets of data analytics.
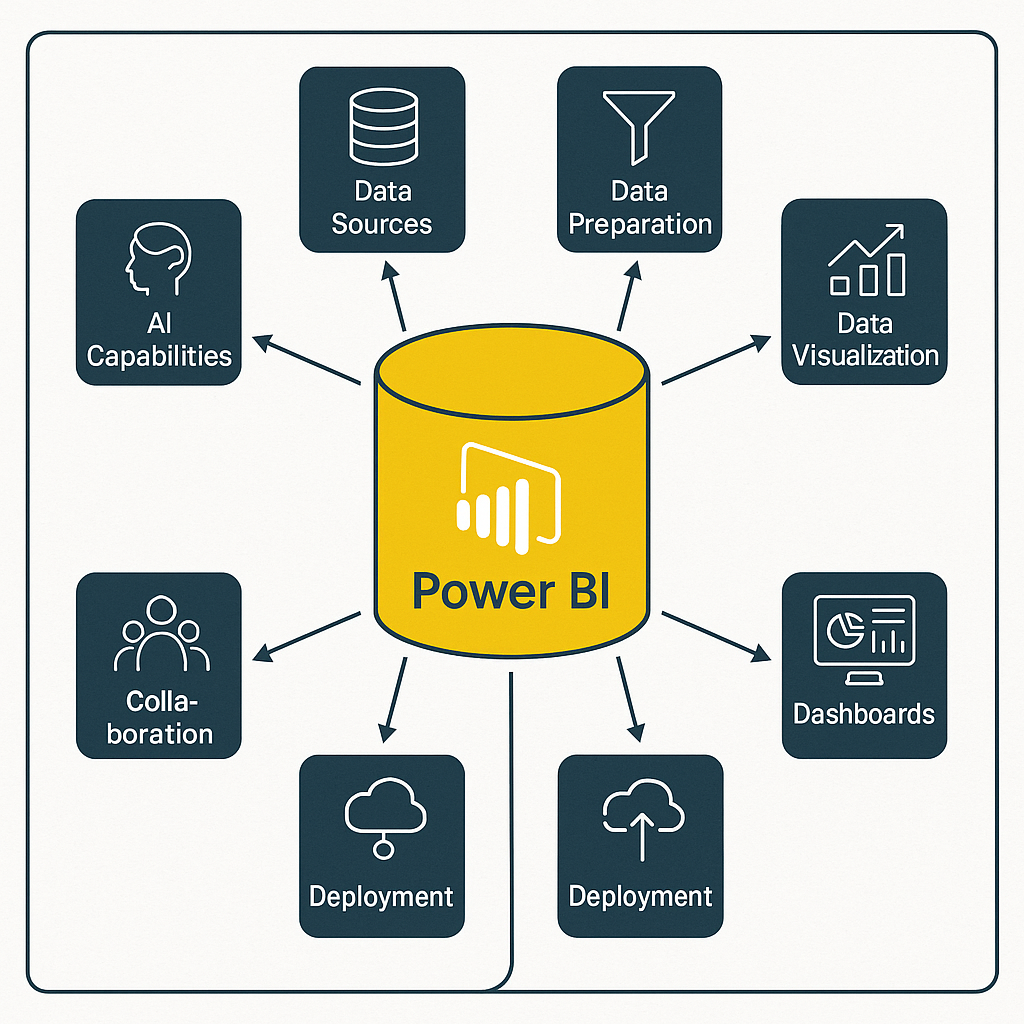
Power BI is a powerful business intelligence tool that significantly enhances data analysis with its straightforward and robust features, enabling the collection, analysis, visualization, and sharing of data insights in real-time. It connects to multiple data sources—such as Excel, databases, APIs, and cloud services —providing easy access. However, you would still need skilled data analysts to extract more insightful data.
Let’s explore how Power BI can unlock your data secrets and likely boost your marketing and sales campaigns.
How Does Power BI Empower Data Analysis
Power BI is Microsoft’s flagship business intelligence tool - a powerhouse that transforms raw data into interactive, actionable reports.
It connects your data, whether from spreadsheets, cloud apps, or SQL databases, to many data sources and turns it into insightful, easy-to-understand visuals.
Some may say that BI is similar to Excel, but it is more than just a program with a few additional features, which is untrue. Unlike Excel, which struggles with large datasets, Power BI handles millions of rows of data, connects to 500+ data sources, and delivers real-time insights through simple dashboards.
For instance, a retail company may use Power BI to automatically pull sales data from its online store, physical outlets, and CRM system. With a live dashboard, managers can instantly see which products are selling best, which regions are underperforming, and forecast upcoming trends—all without manual spreadsheet work.
Here is an example: Imagine a clothing brand like H&M tracking daily sales across more than 500 stores. Instead of waiting for monthly reports, Power BI provides real-time insights into product performance, enabling managers to adjust promotions and inventory on the fly to maximize revenue.
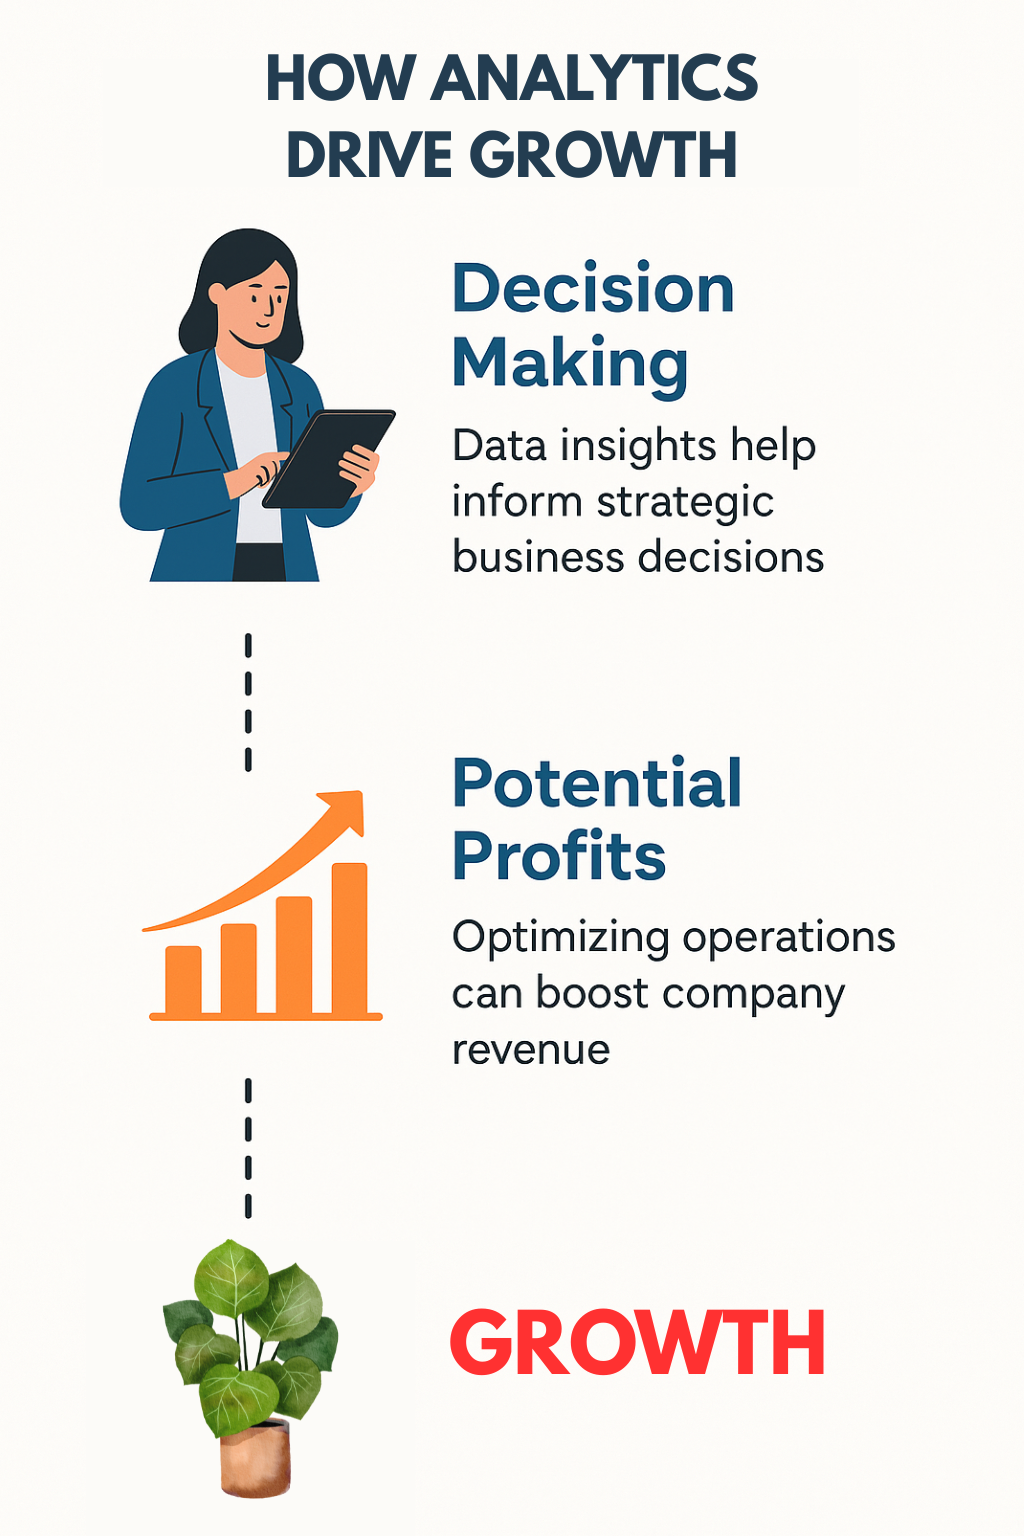
A study by Aberdeen Group found that companies using business intelligence (BI) tools and ERP systems, such as Dynamics 365, experience a 26% improvement in decision-making speed.
Key Features That Make Power BI a Profit Machine
Let’s dig into some key features and how they make Power BI a must-have tool for a business driven by data insights.
1. Real-Time Dashboards
No more waiting days for reports. With Power BI, you get real-time business intelligence with auto-updating dashboards.
Whether you are tracking inventory, monitoring sales, or overseeing marketing and CSR performance, everything updates in live dashboards.
How it helps: Faster decisions lead to faster actions, resulting in more efficient operations.
2. Custom Data Visualizations
Charts and graphs form the core of data visualizations, making it easier and quicker to share insights.
Power BI is packed with custom visuals, such as heat maps, waterfall charts, and funnel graphs, to visualize data according to your preferences. You can switch from one chart type to another with a click to improve your strategy.

How it helps: Clearer visuals enable stakeholders to see the story in the data, leading to quicker buy-in and more informed strategies.
3. Natural Language Query (Q&A)
Power BI has its own ChatGPT! Ask it like you are texting a friend: "What were the total sales last quarter?" Power BI answers with an assertive reply.
You don't need to be a programmer to use the BI tool. Its intuitive interface lets you easily transform messy data with Power Query and connect to various databases, including SQL, Excel, and Salesforce.
How it helps: Your team can explore data without needing SQL skills. Empowered employees make better, faster decisions.
4. Seamless Integration with Microsoft Stack
Already using Excel, Teams, or SharePoint? Power BI seamlessly integrates with Microsoft tools and thousands of third-party data sources, including Azure, SQL Server, Google Analytics, Salesforce, SAP, Python, and R.
How it helps: You save time and money by leveraging tools you already use and expanding their functionality.
5. AI-Powered Insights
Power BI is an AI/ML-driven platform programmed with algorithms to carry out various tasks. It is like having a data scientist who can automatically detect patterns, forecast outcomes, and highlight anomalies.
Specifically, Power BI’s AI capabilities can predict future sales using trained data and neural networks, detect anomalies such as sudden profit drops, and generate natural language summaries (e.g., "Show me the top customer's day last quarter").
How it helps: Predictive analytics means taking action before problems occur or opportunities slip away.
Enabling Power BI Blueprint
Let’s put our knowledge of Power BI to the test. Here is a step-by-step guide to extracting helpful insights from the platform.
Step 1: Start With a Clear Business Goal
Do not get a paid version of Power BI without realizing your goals; get a free version from Microsoft and test out a few basic tools.
Begin by defining your business goals: increasing customer retention or reducing marketing costs. The platform will create analytics tailored to your specific needs. Without this, even the best visuals become noise.
Apply your skills from tools like Microsoft Excel to move from building to analyzing to presenting with less prep, and sharpen your skills with advanced tools.
Step 2: Identify and Centralize Your Data Sources
Power BI cannot work its magic without data. Identify and audit your data by consolidating dedicated sources, such as CRM systems, ERP software, Excel files, Google Analytics, social media platforms, and customer support tickets.
Connect these sources into Power BI to create a centralized data ecosystem, allowing you to manage and monitor data analysis from a single user interface (UI).
Step 3: Hire or Offshore a Power BI Expert
This is where many businesses fall short. Power BI's power lies in its use -you need trained and certified analysts to collect, analyze, and visualize data. The process can quickly become complex and diluted from cleaning data, designing relational models, building DAX measures, and managing real-time dashboards.
Otherwise, consider offshoring it to a skilled Power BI analyst at a fraction of the cost to benefit from both cost efficiency and expertise.
Step 4: Design Action-Oriented Dashboards
Power BI experts should be able to create dashboards that visualize key performance indicators (KPIs) tied directly to your business goals.
Keep visuals intuitive and interactive, starting with simpler ones. Your dashboards should tell a story and highlight the actions that need to be taken.
Each stakeholder should be able to access and comprehend the visual reports. Likewise, utilize slicers, filters, and drill-downs to provide users with complete control over the insights they require.
Step 5: Automate, Forecast, and Optimize
Once you become familiar with Power BI and its features, consider automating tasks, such as setting up real-time alerts for anomalies, sudden drops in sales, or inventory shortages.
Utilize forecasting tools to anticipate future trends and automate routine reports, ensuring that decision-makers always have access to the most up-to-date data.
This ensures that Power BI operates continuously, providing your team with insights to act on whenever needed.
How to Get a Proficient Data Analyst to Master Power BI
Power BI is a robust tool that requires a seasoned user, like an editing app. From cleaning and modeling data to presenting insights using visuals, familiarity with the platform becomes a key accelerator for quickly processing and presenting insights.
Most companies use only about 10% of Power BI’s features due to a lack of expertise. Here are a few essential tips to help you choose a proficient Power BI master.
- Strong Data Modeling Skills: Look for expertise in designing efficient data models—including relationships, normalization, and DAX formulas—to ensure scalable, fast reports.
- Mastery of DAX and Power Query: Proficiency in DAX (Data Analysis Expressions) for complex calculations and Power Query for data transformation is critical.
- Ability to Connect Multiple Data Sources: A true expert should be able to easily integrate data from various sources, including Excel, SQL databases, APIs, Azure, and other third-party platforms.
- Visual Storytelling Ability: Look for someone who understands UX/UI best practices in visualization, not just creating colorful charts.
- Real-Time and Predictive Analytics Knowledge: Ability to set up real-time dashboards, streaming datasets, and predictive models using Power BI’s AI capabilities.
- Experience with Deployment and Governance: For larger setups, they should be familiar with Power BI Service, workspaces, row-level security (RLS), and managing permissions and licensing.
- Business Acumen and Analytical Thinking: Beyond technical skills, they should understand business processes—translating complex, real-world data into actionable insights that drive informed decision-making.
- Communication and Collaboration Skills: Look for someone who can explain technical concepts to non-technical stakeholders and work effectively with marketing, finance, and operations teams.
Why Choose an Offshoring Data Analysis Partner
Hiring in-house data analysts can be expensive, and providing bonuses and benefits can often put a significant strain on the budget. In the United States, the average annual salary for a senior data analyst ranges from $80,000 to $120,000, excluding benefits. On the other hand, an expert in an offshore location can deliver the same quality for 2/3rd of that price, significantly cutting costs without compromising quality.
Let’s be honest: a business should care about how quickly it can get its hands on the reports. Offshoring Power BI services may give you that edge.
It unlocks a scalable, agile, and highly skilled data analytics infrastructure without the overhead of hiring and maintaining an in-house team.
So, if you are serious about unlocking new revenue, cutting waste, and making smarter decisions, do not hesitate to hire a budget-friendly offshore data analysis team.
Comments(0)
Your email address will not be published. Required fields are marked *
Recommended Posts
Why More Startups Are Offshoring Data Engineering Roles in 2025
Unlocking Global Talent for Faster, Smarter, Scalable Growth through Offshoring Data Engineering
How to Empower Your Web Development Project in 2025?
Empowering Your Web Build with the Right Strategy, Stack, and Global Talent Network
6 Tips for Selecting the Best Offshoring Team for IT Roles
Smart Scaling Starts Here: How to Choose Offshore Talent Without Compromise
RECOMMENDED TOPICS
TAGS
- offshoring
- outsourcing
- web development
- artificial intelligence
- legacy software
- app development
- saas
- remote team
- offshore
- business process automation
- it support
- digital marketing
- data analytics
- voice search optimization
- seo
- agentic ai
- tiktok
- growth hack
- cloud computing
- engineering
- cybersecurity
- it sustainability
- ai engine
- recommender engine
- development
- sprint planning
- modular app
- cloud based
- api based
- data entry
- api workflow
- service level agreements
- data warehouse
- database
- cloud storage
- offshore talent
- global talent pool
- techical consulting
- power bi
- business intelligence
- backoffice
- communication
- outsource
- it roles
- data engineering
- data engineer
- content development
- business development
- it infrastructure
- insurtech
- insurance
- web security
- project management
- pms
- project management system
- agile methodology
- data
- data centric approach
- customer insight
- data decision
- test
- off
About
Data Not Found
NEWSLETTER
Related Posts

How to Empower Your Web Development Project in 2025?
Empowering Your Web Build with the Right Strategy, Stack, and Global Talent Network

Benefits of Technical Consulting in Professional Marketing Strategy
Bridging Innovation and Strategy for Unstoppable Growth